Business problem
Within the same week, Black Barn was asked the same question by both a customer and a former colleague:
What is best to use in SAP Datasphere: a Graphical View or a SQL View?
The honest answer is that it depends on the purpose of the model, the skill set of the team and the level of complexity that needs to be supported over time. The answer is not as simple as saying that one approach is always right and the other is always wrong.
A non-technical salesperson may naturally advocate Graphical Views because they appear to offer a low-code or no-code development experience. The message is attractive: drag-and-drop modelling, faster development and less dependency on specialist developers.
In real projects, the picture is more nuanced. Enterprise analytics models rarely stay simple for long. Logic expands. Exceptions appear. Performance needs to be improved. Requirements change. Other developers or system integrators need to understand what was built months or years earlier. This is where the choice between Graphical Views and SQL Views has a direct impact on delivery speed, maintainability and long-term ownership.
NextLytics published a useful comparison in 2023 that frames the decision around capability, complexity and scalability. Black Barn broadly agrees with that view, but our project experience leads to a stronger recommendation: for most professional SAP Datasphere modelling scenarios, SQL Views should be the default choice.
Architecture overview
Both approaches can produce reusable data models in SAP Datasphere. The difference is the way the transformation logic is expressed, tested, documented and maintained.
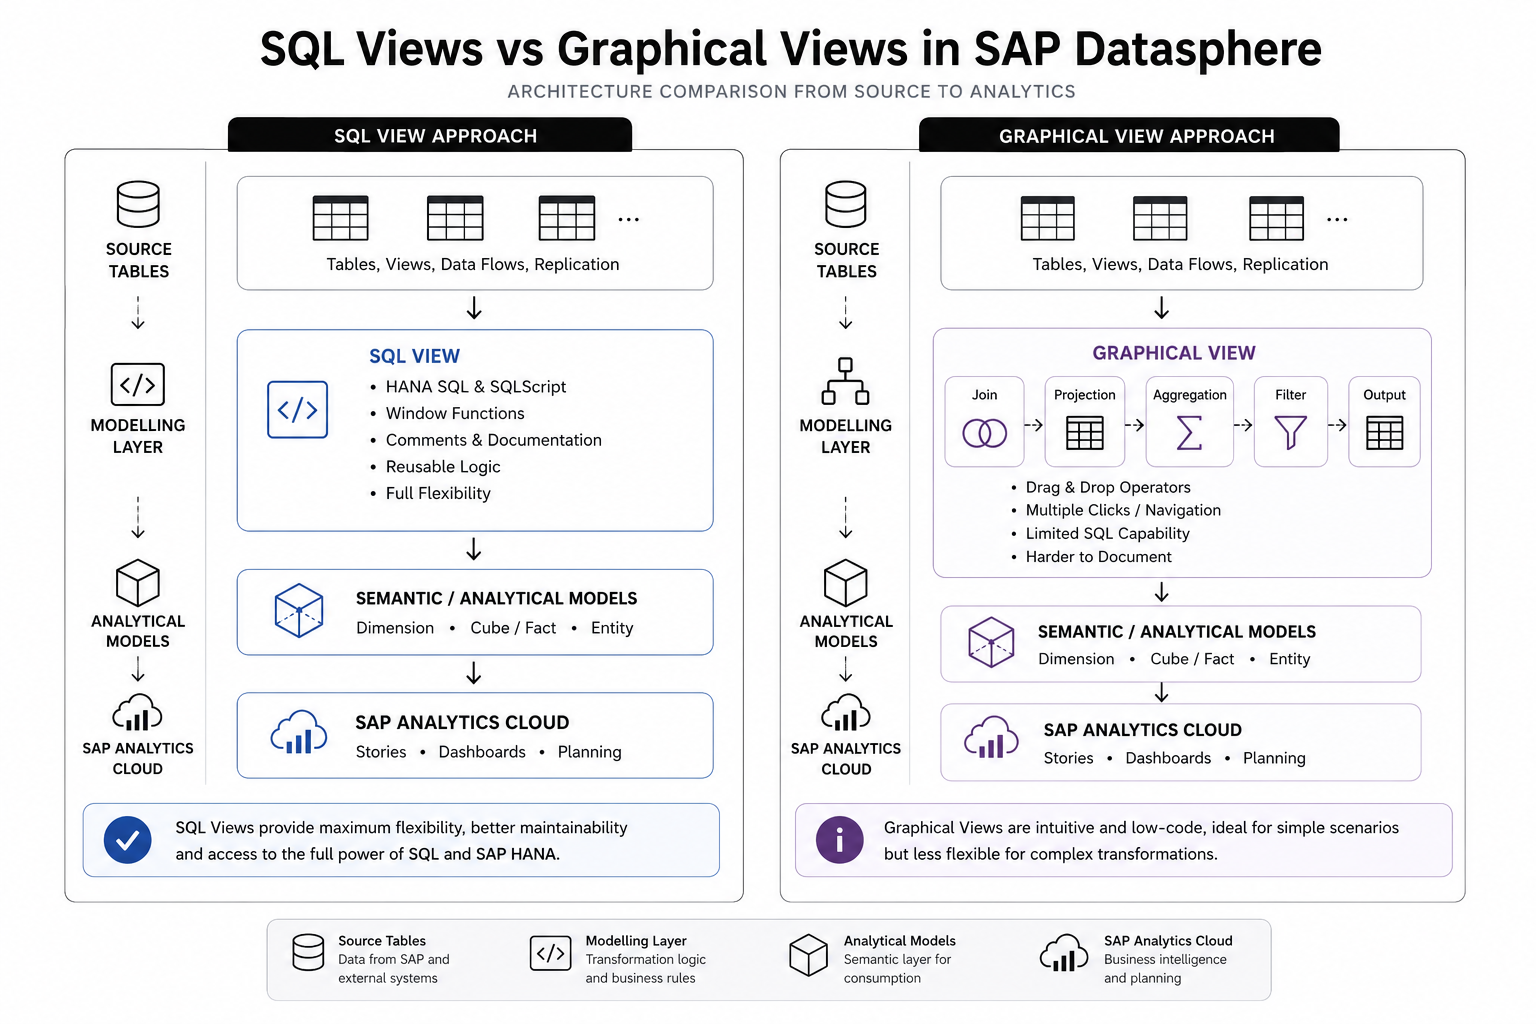
At a high level, the modelling chain is usually similar:
- Source tables, remote tables, replicated tables or local tables provide the raw data.
- Modelling artifacts apply joins, filters, projections, calculated columns, unions, aggregations and business rules.
- The resulting dataset is consumed by Analytical Models, SAP Analytics Cloud stories, planning models or downstream processes.
The practical difference is that Graphical Views spread the logic across visual operators, while SQL Views place the logic in a single SQL definition. That difference becomes increasingly important as models become larger.
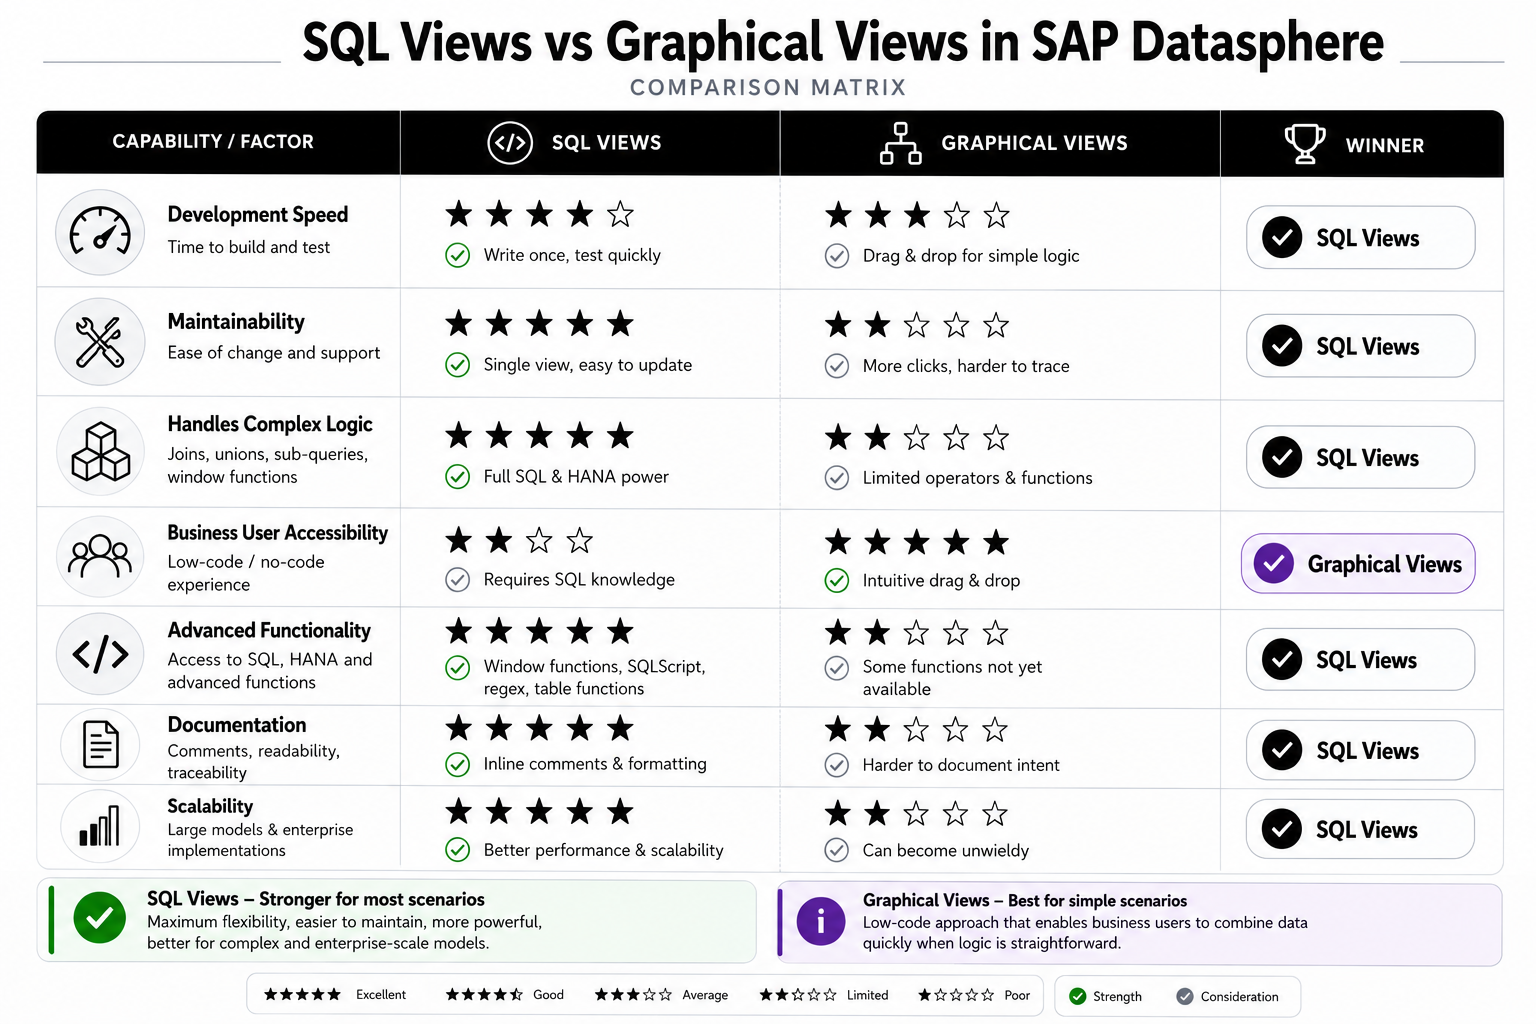
SQL Views vs Graphical Views at a glance
| Capability / Factor | SQL Views | Graphical Views | Black Barn view |
|---|---|---|---|
| Development speed for experienced developers | Excellent | Moderate | SQL Views are usually faster when the developer knows SQL. |
| Business-user accessibility | Moderate | Strong | Graphical Views are easier for non-SQL users to start with. |
| Maintainability | Strong | Weak to moderate | Large Graphical Views can become difficult to understand. |
| Documentation | Strong | Weak to moderate | SQL comments allow detailed inline documentation. |
| Complex logic | Strong | Limited | SQL Views handle complex joins, unions, subqueries and functions more naturally. |
| Advanced HANA functions | Strong | Limited | SQL Views expose more of the HANA SQL capability. |
| Debugging and change speed | Strong | Moderate | SQL logic is visible in one place rather than across many operators. |
| Suitability for simple models | Strong | Strong | Either can work for straightforward cases. |
| Suitability for large enterprise models | Strong | Weak to moderate | SQL Views scale better from a maintenance perspective. |
Use of Graphical Views
The main selling point of Graphical Views is the drag-and-drop, low-code modelling experience. They are aimed at users who understand the business data but may not have strong SQL skills.
For straightforward models this can be useful. A Graphical View can be a sensible choice where the requirement is easy to understand and unlikely to grow into something complex. Examples include:
- selecting fields from a source table
- joining two or three simple datasets
- applying clear filters
- projecting a smaller set of columns
- adding a small number of simple calculated columns
- preparing a small model for a business-user prototype
Graphical Views can also help mixed teams communicate modelling intent. A simple visual model is sometimes easier to explain in a workshop than a SQL statement.
The problem appears when Graphical Views become large. Complex models often require many operators. The developer has to click through joins, projections, filters, calculated columns and output nodes to understand the full picture. Logic that would be visible in one SQL script can become scattered across the canvas.
Black Barn has seen this in failed or struggling Datasphere implementations. Large Graphical Views can be hard to understand, difficult to change and painful to hand over. The more operators a model contains, the harder it becomes to answer basic questions such as:
- where is this field calculated?
- which operator applies this filter?
- why is this join behaving unexpectedly?
- which logic was added for a specific business rule?
- what will break if this part of the model changes?
That does not mean Graphical Views are bad. It means they should be used deliberately.
A good Graphical View use case: controlled initial loads
One useful pattern Black Barn has used is a simple Graphical View as part of an initial data load process. The scenario is deliberately narrow: an input table, a projection, a filter and an output. The Graphical View acts as a simple controlled selection layer, while orchestration and persistence are handled elsewhere.
In this pattern, the wider process may include:
- a date range control table
- a SQL View that identifies the next date range to load
- a Graphical View with a
SELECTfilter for a specific range - a Data Flow called recursively every few minutes
- a Local Table that stores the persisted result using upsert logic
- a Task Chain that updates the next date range status to
LOADING
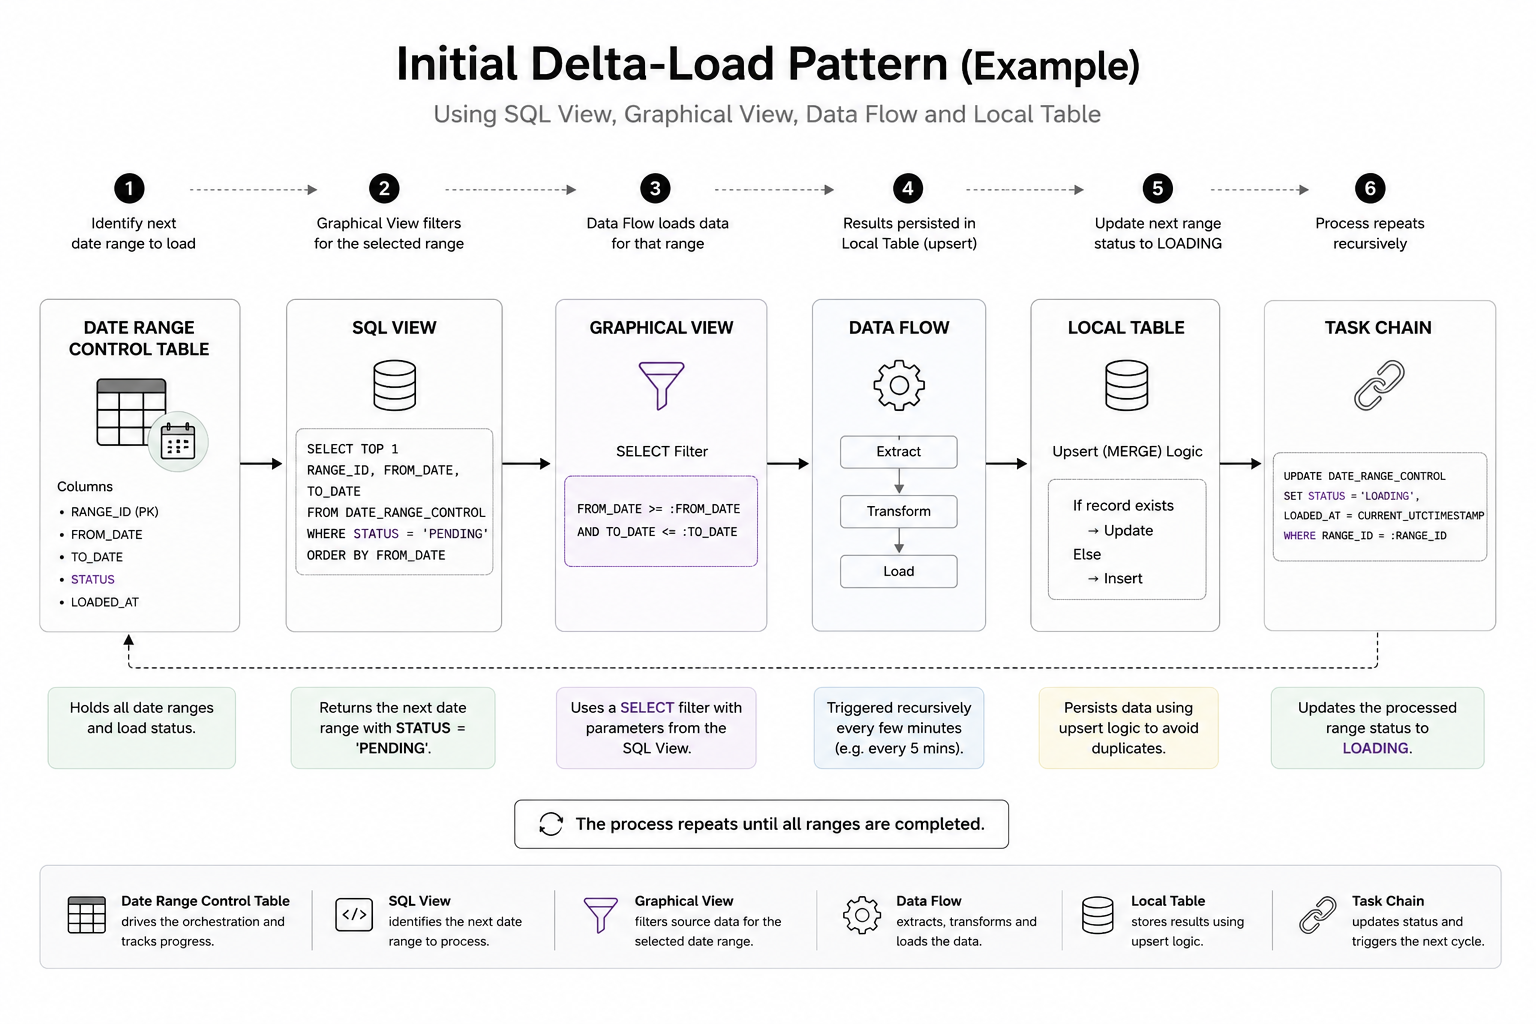
This is the type of scenario where a Graphical View can make sense: the view is small, the intent is clear and the logic is not trying to become an entire application.
Use of SQL Views
SQL Views provide flexibility and control. For experienced developers, they are usually quicker to create, easier to test and easier to maintain than a graphical equivalent.
SAP Datasphere SQL Views generally come in two forms:
- Standard SQL Views — used for most modelling scenarios.
- Table Functions / SQLScript — used where procedural logic or more advanced scripting is required.
Most requirements should start with a standard SQL View. Table Functions should be reserved for cases where a standard SQL statement is not sufficient.
The biggest practical advantage of SQL Views is that the logic is visible in one place. A developer can read the joins, filters, calculated columns, unions and comments without opening multiple operators. This matters during delivery, but it matters even more during support and change requests.
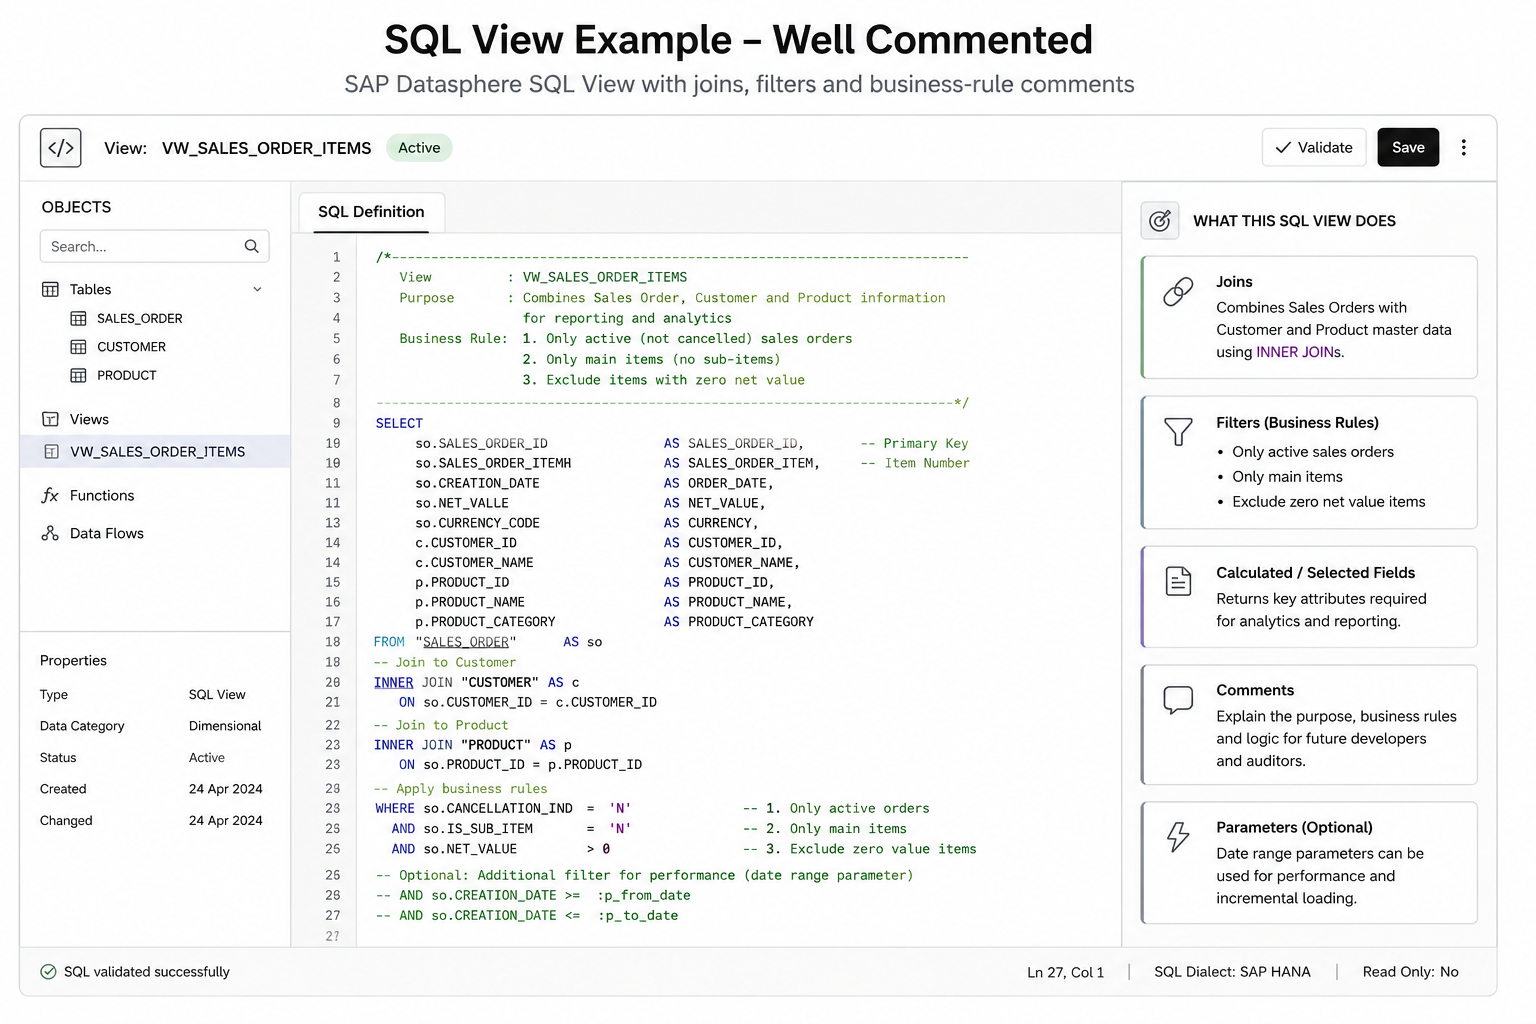
SQL Views also allow verbose comments. That is not a minor feature. Good comments explain the business reason behind the logic, not just the technical syntax. Future developers, internal teams and system integrators can understand why the model exists and why specific choices were made.
/*
  Purpose:
  Prepare sales order measures for analytical consumption.

  Business rule:
  Exclude cancelled items and derive reporting period from posting date.

  Notes:
  Keep this logic close to the source model so downstream analytical models
  remain simple and reusable.
*/
select
    sales_order_id,
    item_id,
    posting_date,
    year(posting_date)      as reporting_year,
    month(posting_date)     as reporting_month,
    net_amount
from sales_order_items
where cancellation_status <> 'X';
This kind of documentation is extremely valuable in real projects. It helps teams avoid the classic situation where nobody wants to touch a model because nobody understands why it was built that way.
Advanced functionality matters
There is no getting away from coding in an analytics environment. Even when a tool provides a graphical modelling interface, real-world data logic often requires expressions, functions, conditional rules and edge-case handling.
SQL Views give developers direct access to HANA SQL capability. This is important because some functions and patterns are either unavailable, harder to express or less convenient in Graphical Views.
Examples referenced in the original Black Barn presentation include:
OVER PARTITION BYDATS_IS_VALIDINITCAPREPLACE_REGEXPRCONCAT_NAZ
Window functions alone are a major reason to use SQL Views in many scenarios. Ranking, partitioned calculations, running totals, first/last record logic and de-duplication patterns are far easier to express directly in SQL than by building large graphical chains.
SQL also gives the developer more control over readability. A well-formatted SQL View can show the full intent of a model in a compact and reviewable form. That is not always possible when the same logic is spread across many graphical operators.
Maintainability is the real decision factor
The decision should not be based only on which option is quicker to build on day one.
The more important question is:
Which option will be easier to understand, support and change six months from now?
This is where SQL Views usually win.
A model may be created by one developer and maintained later by another developer, an internal support team or a different implementation partner. If the logic is contained in clear SQL, the next person can read it, format it, comment it and test it using familiar development practices.
With large Graphical Views, the next person often has to inspect the canvas manually. They may need to open each operator, check field mappings, inspect filters, review calculated columns and mentally reconstruct the flow. That effort increases with every additional operator.
This is why Black Barn recommends SQL Views for the vast majority of professional modelling work in SAP Datasphere.
Best approach: Black Barn point of view
Our view is direct:
This applies across most semantic usages. The time taken to learn HANA SQL and SQLScript will be paid back many times over through faster delivery, clearer models and easier maintenance.
That does not mean every Graphical View should be avoided. It means Graphical Views should be used where their simplicity is genuinely useful and where the model is likely to remain simple.
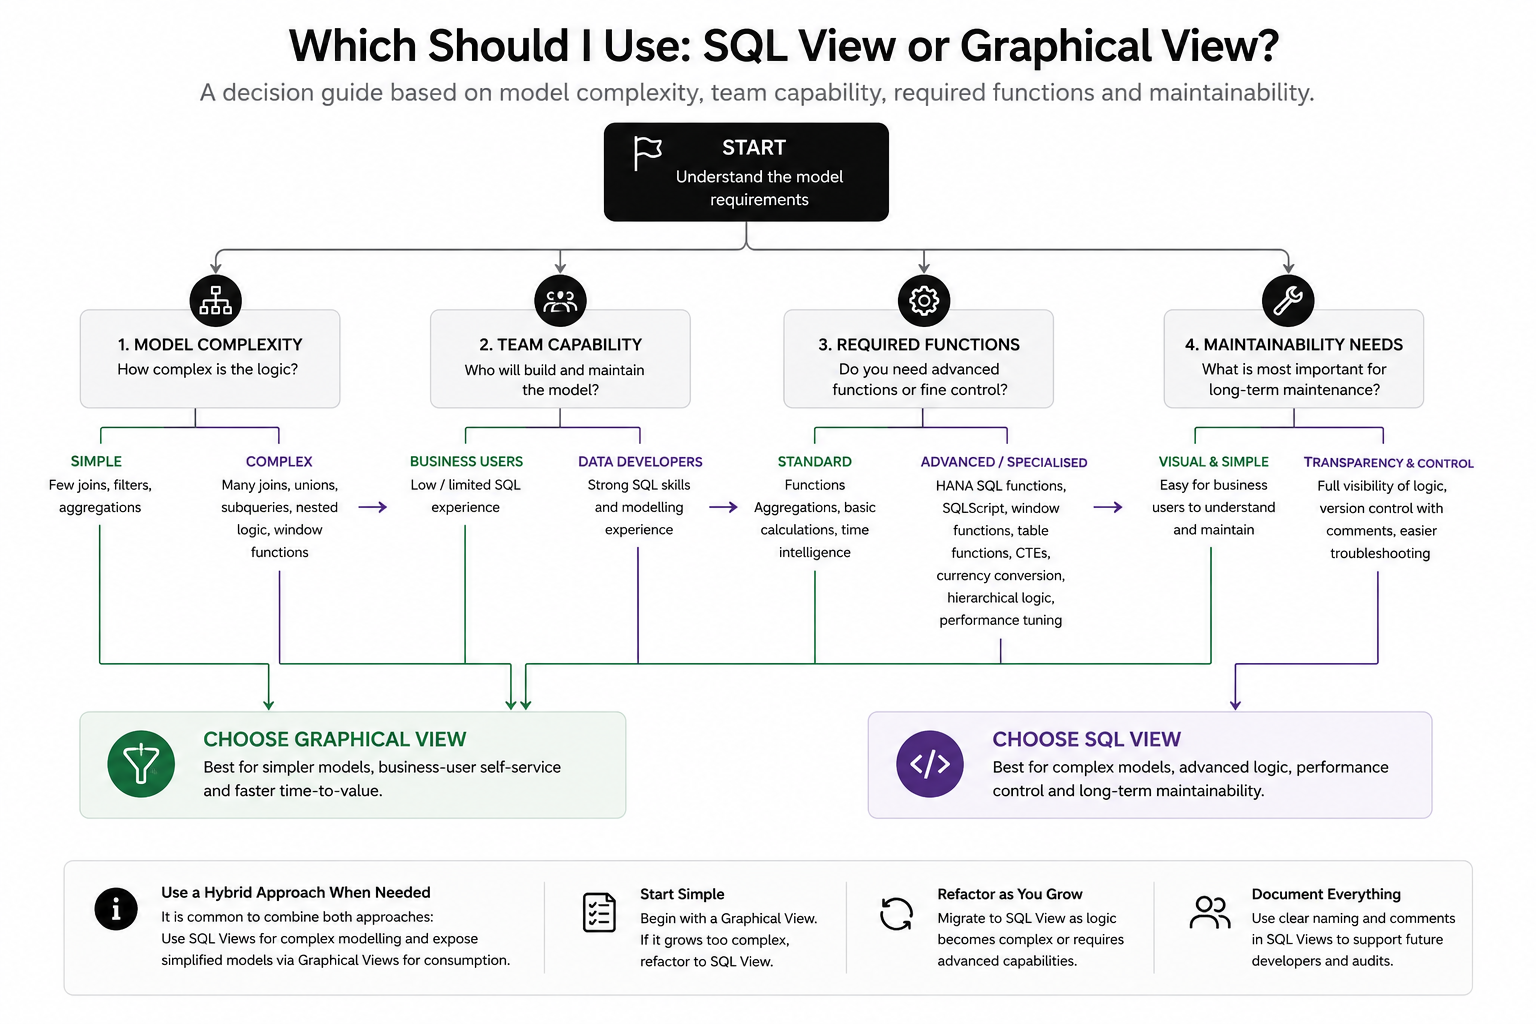
Use SQL Views when
- the logic contains multiple joins or unions
- the model requires advanced SQL or HANA functions
- the result needs detailed comments and clear developer documentation
- the model will be maintained by technical teams
- performance tuning may be required later
- the requirement is likely to evolve
- the logic needs to be reviewed quickly by another developer
- the model forms part of a wider enterprise data architecture
Use Graphical Views when
- the model is genuinely simple
- business users need to understand or maintain it
- the logic is limited to basic joins, projections, filters and output fields
- the view is part of a narrow controlled pattern
- the visual representation helps communication more than it harms maintainability
Be cautious when
- a Graphical View starts to contain many operators
- filters and calculations are scattered across the canvas
- the same logic would be clearer in a short SQL statement
- developers cannot easily explain the model from end to end
- change requests require repeated clicking through operators
- the model becomes difficult to test or document
Recommended delivery approach
For a professional SAP Datasphere project, Black Barn recommends the following practical approach:
- Train administrators, in-house developers and SI partners in HANA SQL. SQL is an essential skill for Datasphere projects, not an optional extra.
- Use SQL Views as the default modelling artifact. This keeps logic clear, reviewable and maintainable.
- Reserve Graphical Views for simple and clearly bounded use cases. Do not allow them to grow into large undocumented models.
- Comment SQL Views properly. Explain business rules, assumptions and design choices.
- Keep Analytical Models clean. Push technical transformation logic into reusable modelling layers where it can be governed and tested.
- Review models for maintainability, not just functionality. A model that works today but cannot be understood tomorrow is a project risk.
Used well, SQL Views can reduce project timelines and make change requests easier to deliver. Used poorly, Graphical Views can become a maintenance burden even if they were initially attractive as a low-code option.
Conclusion
SAP Datasphere supports both SQL Views and Graphical Views because both approaches have a place. Graphical Views are useful for simple, visual modelling scenarios and for users who are not comfortable writing SQL. SQL Views are usually the stronger option for complex, maintainable and scalable enterprise modelling.
Black Barn’s recommendation is to build a strong SQL capability within the project team and use SQL Views as the default. Graphical Views should be used selectively, not because they are easier to demonstrate, but because they are genuinely the right tool for a specific simple use case.
The goal is not simply to build models quickly. The goal is to build models that remain clear, maintainable and useful throughout the life of the SAP Datasphere implementation.
Further reading
SAP documentation
- SQL Reference | SAP Help Portal
- SAP HANA Cloud, SAP HANA Database SQL Reference Guide
- SAP HANA Cloud, SAP HANA SQLScript Reference
- SAP Datasphere documentation | SAP Help Portal
- Working with Views | SAP Learning