hana.ST_POINT location column using SAP HANA spatial functions, and consuming the result as a location dimension in SAP Analytics Cloud.
Business problem
Many enterprise datasets contain a natural location attribute.
Examples include:
- company codes;
- plants and storage locations;
- customers and vendors;
- business partners;
- sales organisations;
- regions, cities, countries and postcodes.
These attributes are useful for filtering and grouping, but they do not automatically create a geo map.
A city name or country code alone may be enough for a user to understand the data, but SAP Analytics Cloud Geo Maps normally need a dedicated location dimension. For point-based mapping, that means the data model must provide geographic coordinates in a supported location format.
The challenge is therefore not only to find latitude and longitude values. The challenge is to prepare those values correctly in SAP Datasphere so that they can be consumed reliably by SAP Analytics Cloud.
Why geo modelling matters
Geo visualisation is often treated as a presentation-layer feature, but the quality of the map depends heavily on the modelling layer.
If the model is not prepared correctly, users may experience:
- locations that do not plot;
- locations plotted in the wrong place;
- inconsistent country or city matching;
- duplicate points;
- missing coordinates;
- poor usability in SAP Analytics Cloud;
- technical workarounds in the story layer.
Black Barn recommends treating geo enablement as a modelling concern rather than a last-minute visualisation task.
The goal is to provide a clean, governed location dimension that can be reused across stories, measures and business scenarios.
Source location attributes
The first step is to identify the location attributes already available in the source data.
For SAP S/4HANA and similar transactional systems, useful location attributes may already exist on master data objects. For example, a plant may have a city, country and address. A customer may have postal information. A company code may be linked to a country or city.
In some cases, the source system may already contain longitude and latitude. In other cases, the source data needs to be enriched.
Common enrichment keys include:
| Source attribute | Typical use |
|---|---|
| Country code | Broad country-level mapping or enrichment join. |
| City name | City-level coordinate lookup. |
| Postcode or ZIP | More precise regional mapping where available. |
| Address | Higher precision matching, but usually more data-quality sensitive. |
| Business partner location | Useful for customer, vendor or site-based analysis. |
For many reporting scenarios, city and country are sufficient.
Longitude and latitude enrichment
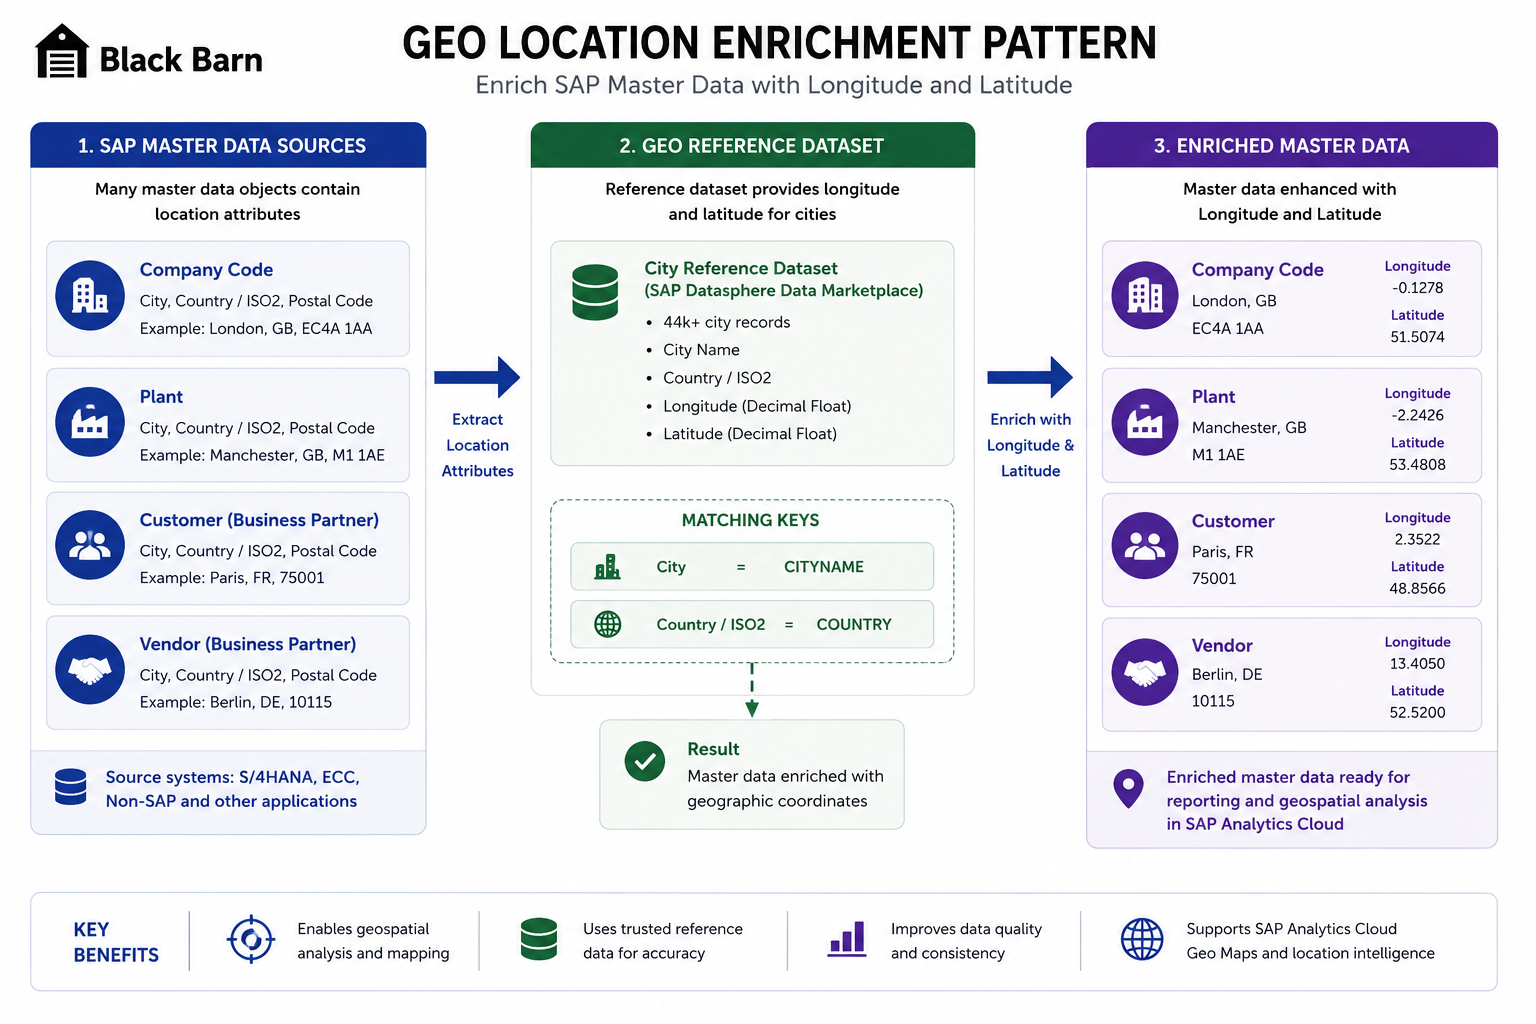
SAP master data such as company code, plant, customer and vendor can be enriched with longitude and latitude using a governed city and country reference dataset.
If longitude and latitude are not already present in the source system, they can be added through a reference dataset.
Typical reference data options include:
- publicly available city and country coordinate datasets;
- internally governed location reference data;
- SAP Datasphere Data Marketplace datasets;
- third-party geocoding providers;
- postal or address-quality services.
The key design point is to avoid embedding this lookup directly into every consuming model. Instead, enrich the master data once and expose reusable longitude and latitude attributes from the dimension or supporting view.
A practical example is enriching company code data by matching:
Company Code CITYNAME + COUNTRYto a reference dataset containing:
City + ISO2 Country Code + Longitude + LatitudeThe result is a dimension that contains business attributes together with numeric longitude and latitude columns.
Converting coordinates to a location point
SAP Analytics Cloud Geo Maps can use a location dimension based on spatial point data.
In SAP Datasphere, longitude and latitude values can be converted using SAP HANA spatial functions.
A practical SQL expression is:
NEW ST_POINT(
  TO_DECIMAL("LOC"."lng"),
  TO_DECIMAL("LOC"."lat")
).ST_SRID(4326).ST_TRANSFORM(3857) AS "POINT"
The logic is:
- Create a spatial point from longitude and latitude.
- Assign the source spatial reference identifier.
- Transform the point to the required target spatial reference.
- Expose the result as a location column.
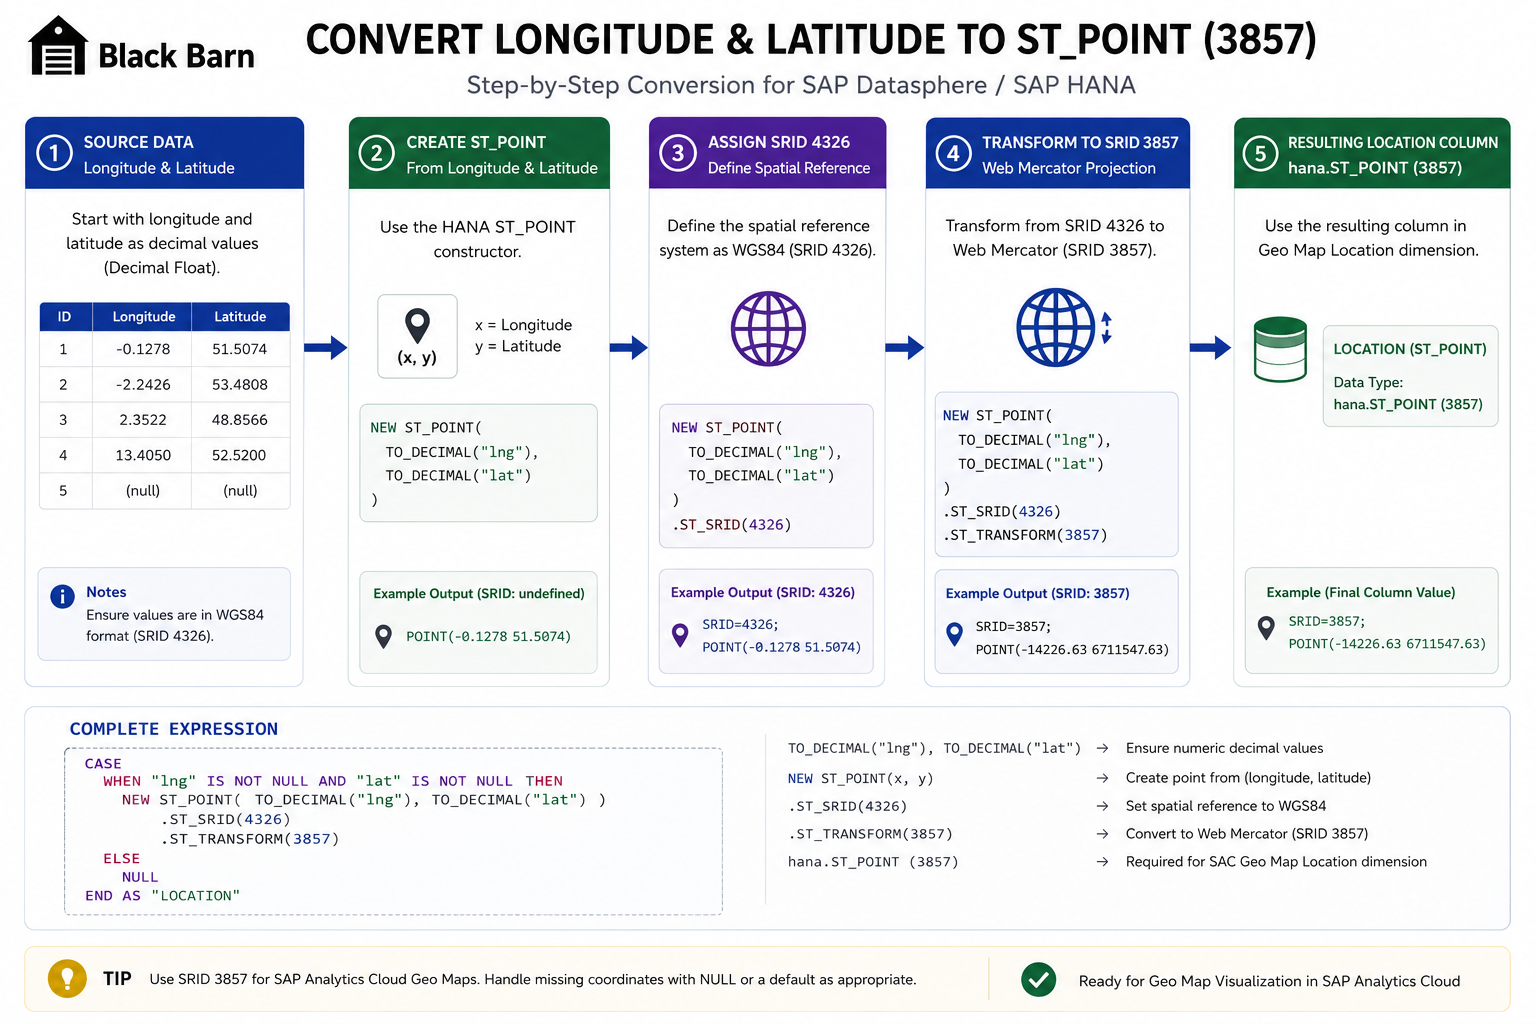
Longitude and latitude values are converted into an SAP HANA spatial point, assigned SRID 4326, transformed to SRID 3857 and exposed as a reusable location column.
The resulting column should be typed as a spatial point, typically:
hana.ST_POINT (3857)This is the column that can then be selected as the location dimension for SAP Analytics Cloud Geo Maps.
Handling missing coordinates
Real-world master data is rarely perfect.
Some records may not have a city. Others may have inconsistent spelling, missing country codes or locations that do not exist in the reference dataset.
The model should therefore include a deliberate fallback pattern.
For example:
CASE
  WHEN "LOC"."lng" IS NOT NULL
   AND "LOC"."lat" IS NOT NULL
  THEN NEW ST_POINT(
    TO_DECIMAL("LOC"."lng"),
    TO_DECIMAL("LOC"."lat")
  ).ST_SRID(4326).ST_TRANSFORM(3857)
  ELSE NULL
END AS "POINT"
This avoids creating invalid points and makes it easier to identify unmatched master data.
Black Barn also recommends exposing a simple status or quality flag, such as:
| Flag | Meaning |
|---|---|
| Matched | Coordinate found and point created. |
| Missing source location | Source record has no usable city, country or postcode. |
| No reference match | Source location exists but could not be matched to the reference dataset. |
| Ambiguous match | Multiple possible reference locations exist. |
This makes the model easier to support and improves trust in the map output.
SAP Datasphere modelling pattern
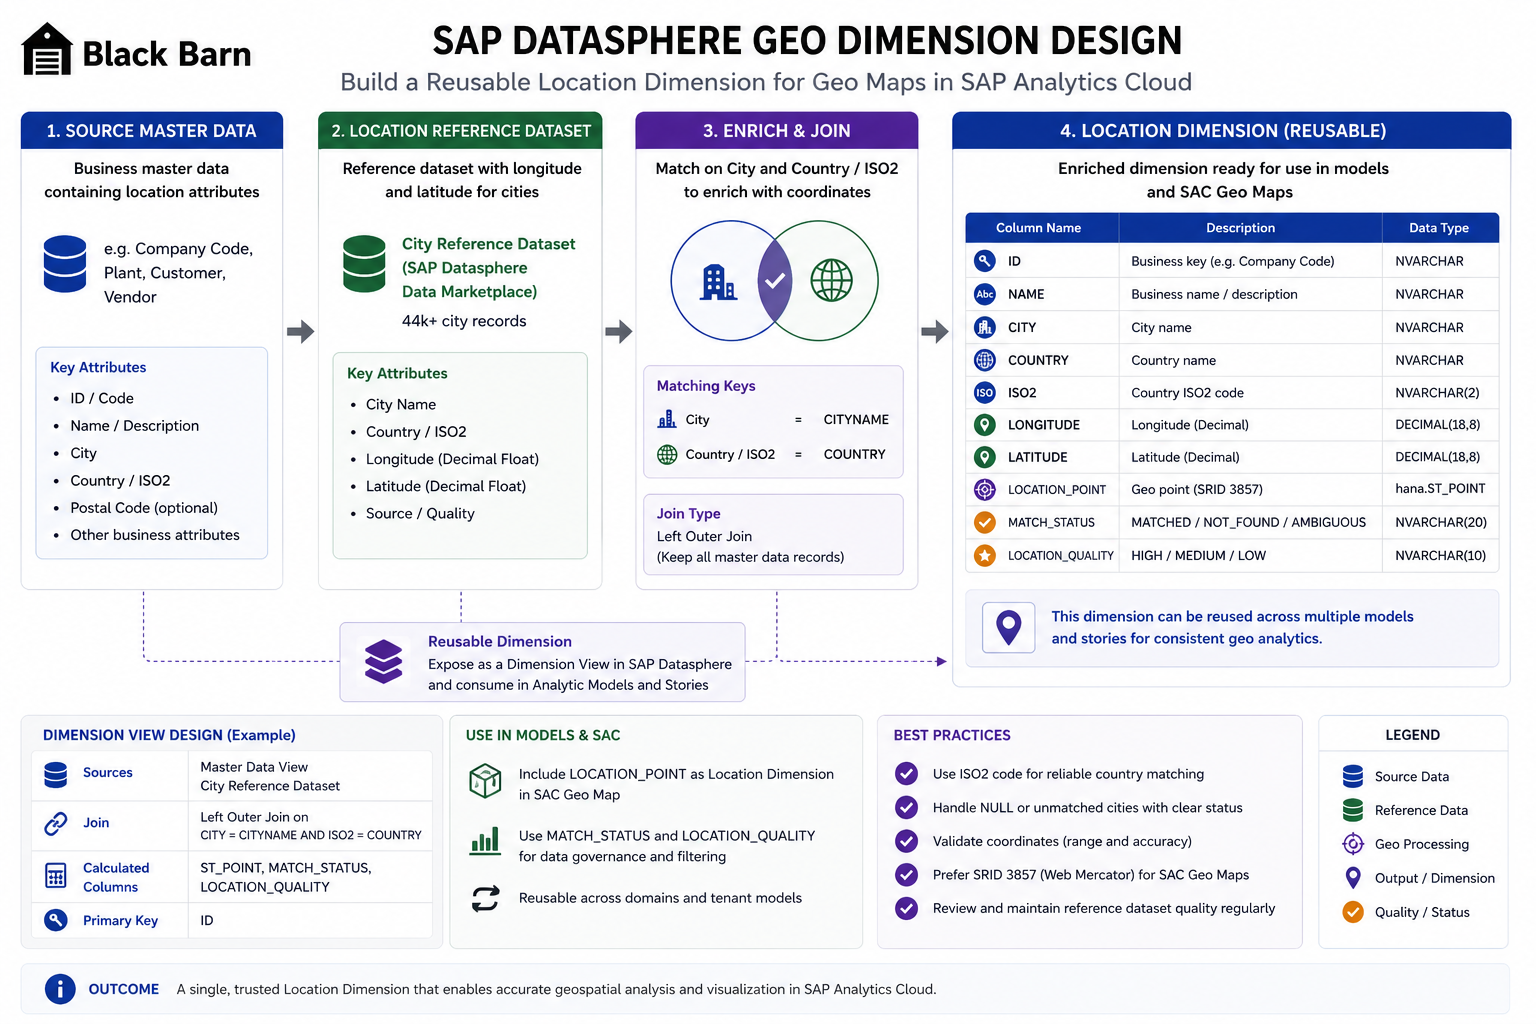
A reusable geo dimension should include business attributes, longitude, latitude, the transformed POINT column, match status and location quality fields.
A good modelling pattern is to separate the geo enrichment layer from the final analytical model.
The recommended structure is:
| Layer | Purpose |
|---|---|
| Source master data view | Provides business keys and location attributes such as city and country. |
| Location reference view | Provides longitude and latitude for known locations. |
| Enriched dimension view | Joins business master data to reference coordinates. |
| Location point view | Converts coordinates into hana.ST_POINT format. |
| Analytic Model | Exposes measures, dimensions and the location column for SAC consumption. |
This keeps the design reusable. The same enriched location dimension can be used for multiple stories and analytical scenarios.
Setting up the SAP Analytics Cloud Geo Map
Once the SAP Datasphere model exposes the location point column, the next step is to consume it in SAP Analytics Cloud.
The typical process is:
- Create or open an optimised SAC Story.
- Add a Geo Map from the available visualisation options.
- Add a content layer in the Builder panel.
- Select the model containing the geo-enabled dimension.
- Choose the location dimension based on the generated point column.
- Add the measure to be plotted.
- Validate that the expected data points appear on the map.
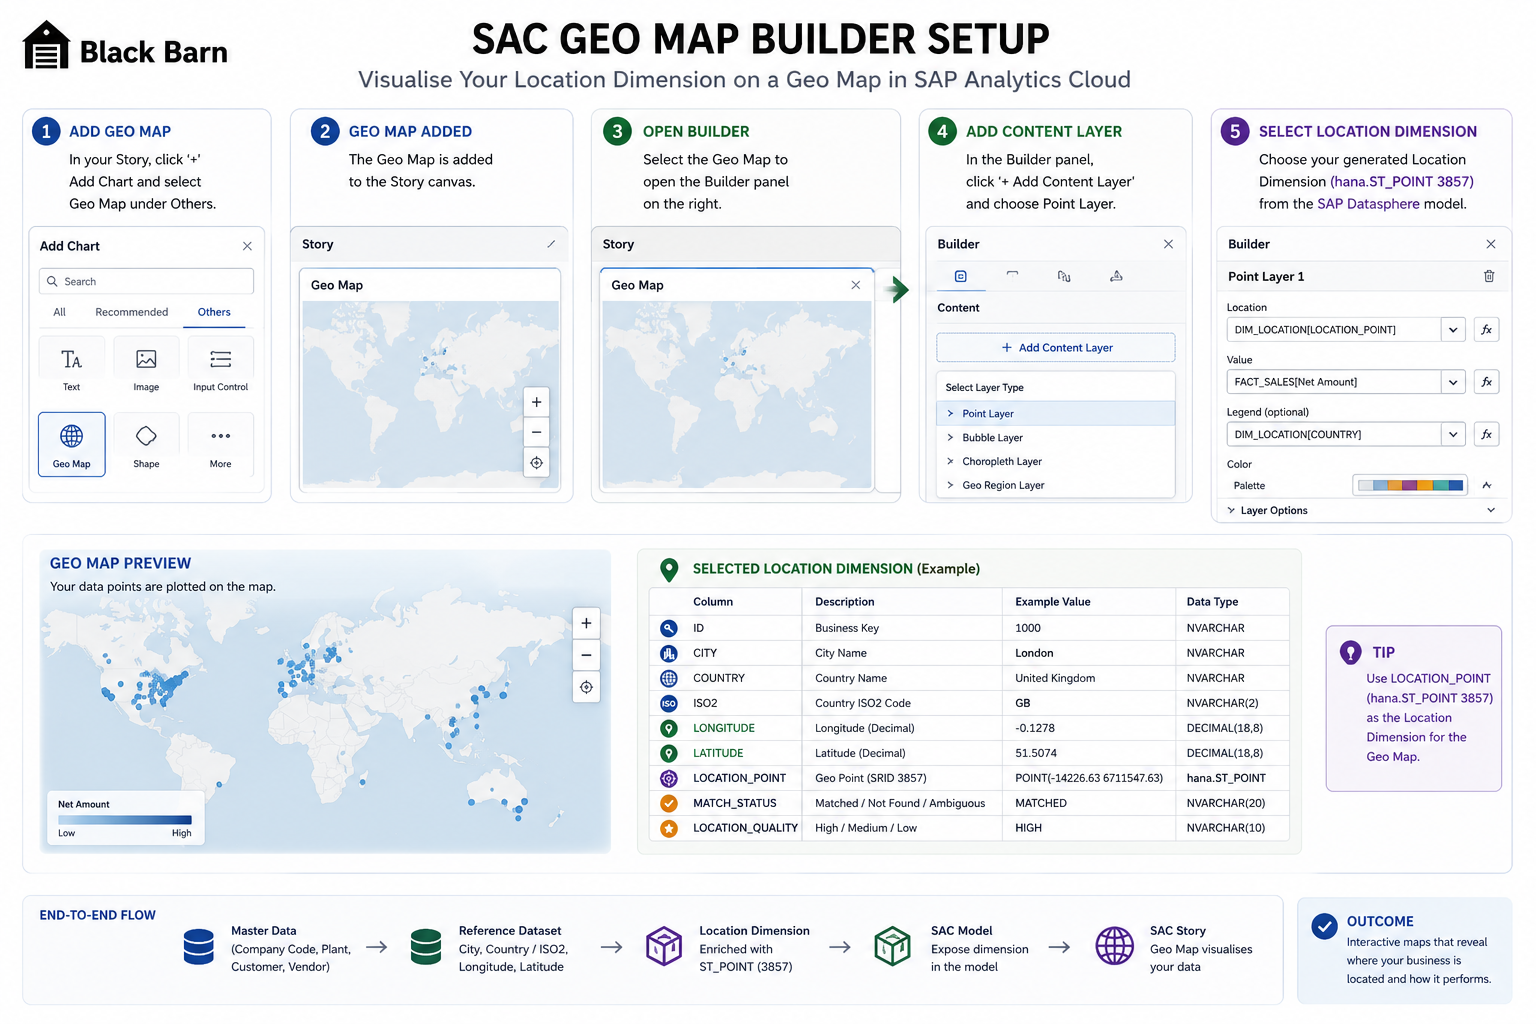
In SAP Analytics Cloud, the generated ST_POINT column is selected as the location dimension for the Geo Map content layer.
The map should then plot the enriched data points.
Depending on the business scenario, the map may show values such as revenue by plant, cost by company code, sales by customer location or operational events by region.
Example output pattern
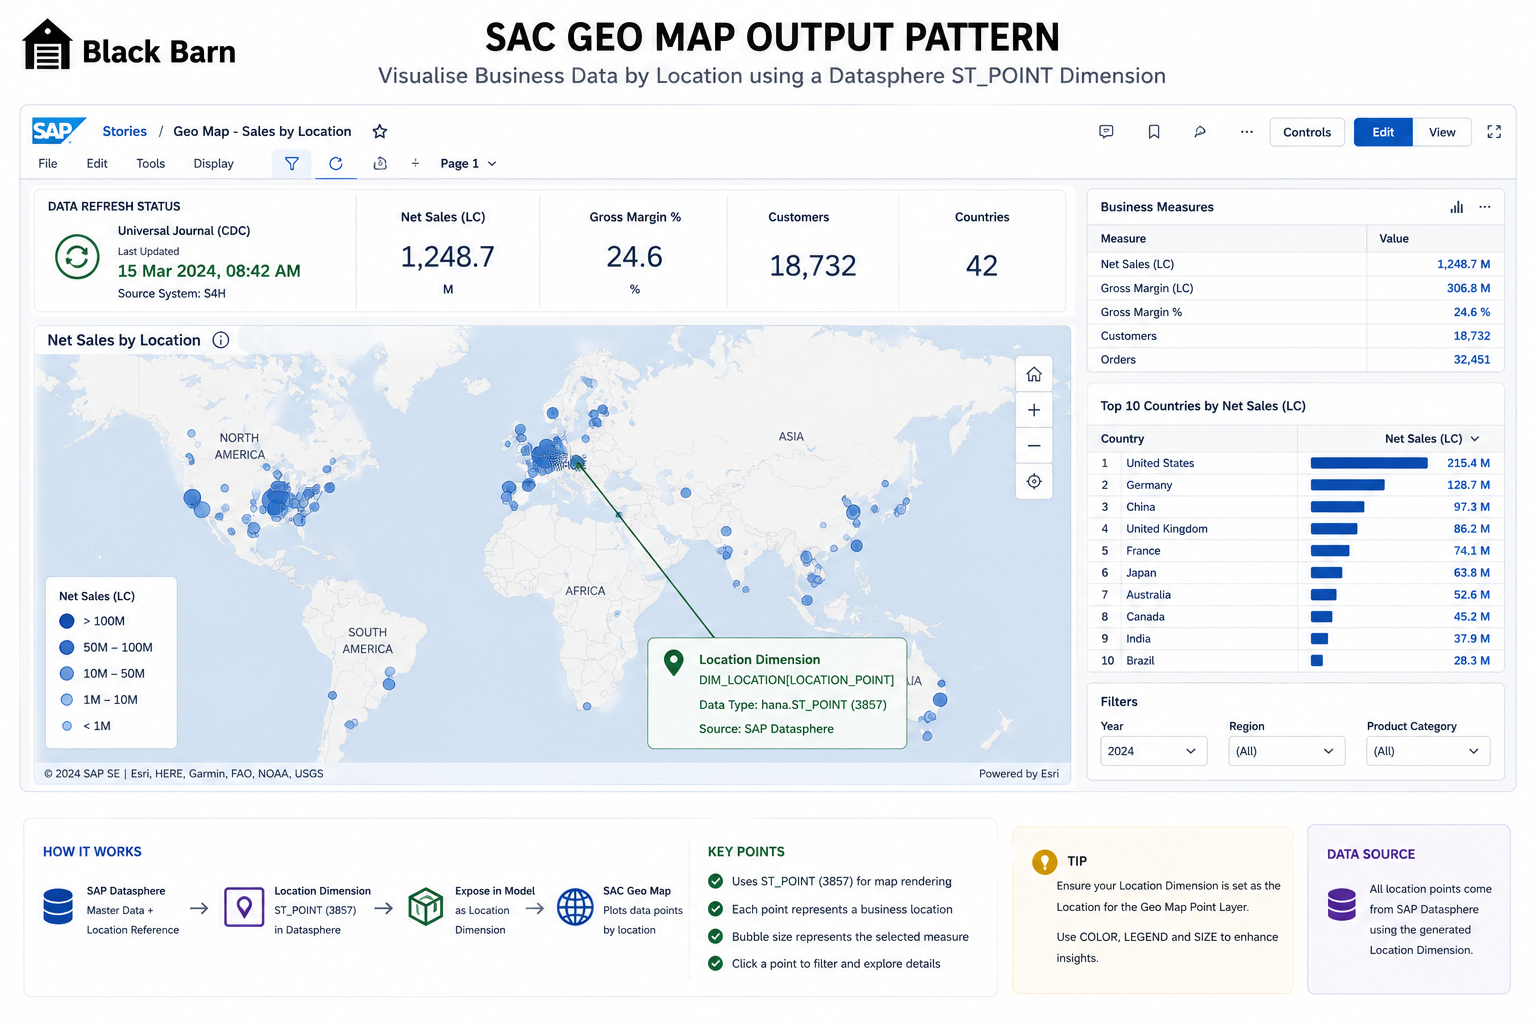
A well-designed SAC Geo Map combines plotted business locations, measures, filters and clear data source context from the SAP Datasphere location dimension.
A well-designed geo output should do more than display points on a map.
It should allow users to understand business performance by location.
Typical use cases include:
- plant performance by region;
- customer concentration by country or city;
- revenue distribution by sales territory;
- operating cost by company code location;
- service events by location;
- risk or compliance exposure by geography.
The map becomes useful when it is connected to a clear business measure and a governed semantic model.
Practical implementation guidance
Black Barn recommends the following delivery approach.
Start with one business object
Do not try to geo-enable every master data object at once.
Start with one high-value dimension such as Plant, Company Code or Customer. Validate the enrichment, point conversion and SAC map behaviour before scaling the pattern.
Keep reference data governed
Latitude and longitude reference data should be treated as part of the data model, not as an unmanaged spreadsheet dependency.
Store it in a governed Datasphere object where it can be refreshed, documented and reused.
Use stable join keys
City names alone can be ambiguous. Where possible, combine city with country, postcode, region or another stable attribute.
Expose data quality information
A geo map with missing points can be misleading. Add match flags so support teams can quickly identify whether missing locations are caused by source data, reference data or modelling issues.
Avoid story-level fixes
Do not fix location problems manually in SAP Analytics Cloud if the issue belongs in the model. The story should consume the location dimension, not become the place where data quality is repaired.
Performance considerations
Geo enrichment is usually lightweight, but there are still practical design considerations.
- Perform coordinate enrichment in the modelling layer, not repeatedly in each story.
- Avoid calculating spatial points repeatedly in high-volume fact queries if a reusable dimension can hold the point column.
- Keep reference datasets appropriately filtered and indexed where possible.
- Use a location dimension instead of duplicating coordinates directly into every fact model.
- Test map performance with realistic data volumes, especially where customer or event-level points are involved.
For many enterprise reporting scenarios, mapping by master data object is more usable than plotting every individual transaction.
Common pitfalls
Avoid these common issues:
- swapping latitude and longitude;
- using text values instead of numeric decimal coordinates;
- failing to assign the source SRID before transformation;
- exposing the point column with the wrong data type;
- assuming every city name is unique;
- creating invalid fallback points;
- hiding unmatched records instead of reporting match quality;
- building separate geo logic in each report.
These problems are usually easy to avoid when the model is designed deliberately.
Black Barn recommendation
Black Barn recommends creating reusable geo-enabled dimensions in SAP Datasphere for business objects that have meaningful location context.
The preferred pattern is:
- Identify the business object and source location attributes.
- Enrich the object with governed longitude and latitude reference data.
- Convert coordinates into a spatial point using SAP HANA SQL.
- Expose a clear location dimension in the semantic model.
- Validate the result in SAP Analytics Cloud Geo Maps.
- Add data-quality flags so unmatched or ambiguous records are visible.
This approach keeps geo logic maintainable, reusable and aligned with the wider SAP Business Data Cloud semantic architecture.
Conclusion
Geo Maps in SAP Analytics Cloud can add significant value when the underlying SAP Datasphere model is prepared correctly.
The important step is converting business location attributes into a governed location dimension that SAP Analytics Cloud can consume reliably.
By enriching master data with longitude and latitude, converting coordinates into a spatial point and exposing the result through a reusable model, organisations can deliver clean geo visualisations without relying on manual story-level workarounds.
For SAP Datasphere projects, this is a small but valuable modelling pattern that can improve both user experience and analytical insight.
Further Reading
SAP documentation
- Create a Geo-Coordinates Column in a Graphical View | SAP Datasphere Help
- Create Models with Coordinate or Area Data for Geo Maps | SAP Analytics Cloud Help
- ST_SRID Method | SAP HANA Cloud Spatial Reference
- Enable Choropleth Layers for Geographical Visualizations | SAP Datasphere Help
- Marketplace Data Product Details | SAP Datasphere Help
SAP tutorials and community resources
- Understand Points in SAP HANA Spatial | SAP Tutorials
- Transforming Spatial Data in SAP HANA | SAP Community
- How to Visualize Your Data Using Geo Maps: SAP Analytics Cloud | SAP YouTube
Reference datasets
- Open Source Country Cities Latitude/Longitude Database | Simplemaps
- Latitude and Longitude for Every Country and State | Kaggle
Black Barn provides independent architecture, implementation and advisory services for SAP Datasphere, SAP Analytics Cloud and SAP Business Data Cloud.